EUR/USD Technical Analysis, 12.10.2012. Medium Term Perspective.
12.10.2012
The EUR/USD currency pair has found a local trading range; however, it’s a short-term one so far. But as it often happened before, it may last for several weeks.
Let’s take a look at the weekly chart (Fig. 1).
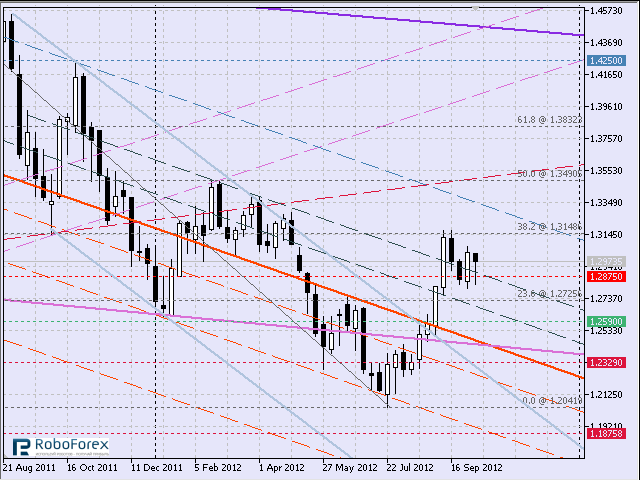
Fig. 1 EUR/USD, weekly time frame
So, in September and October the pair is being stuck between 1.2850 – 1.3150. As a matter of fact, it’s quite common when a correction is taking place and the price is moving between fibo-levels of 23.6% and 38.2%. Is an ascending correction going to continue? We’ll see. I think that while the pair is making a global descending movement, it’s better to open short positions and look for a good point of entry. If the level of 1.3150 is not broken upwards in the future, then the current local maximum will be one more bearish signal, as the previous ones were higher. At the chart we can see a series of descending maximums.
Now let’s look at the daily chart (Fig. 2).
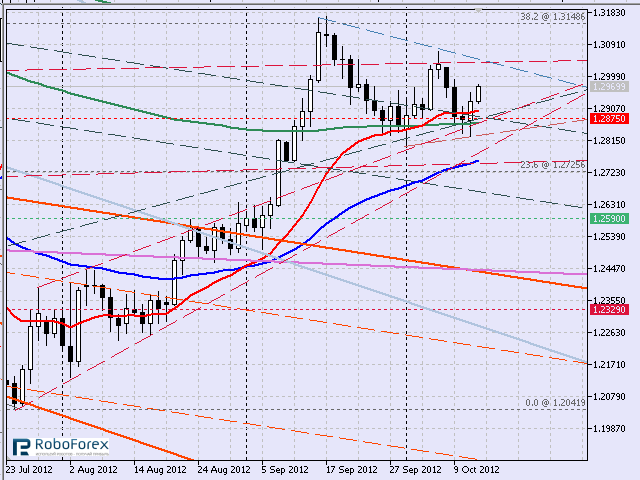
Fig. 2 EUR/USD, daily time frame
At the daily chart we can see a continuation pattern, something like pennant. Right now it’s difficult to say whether it will be completed or not. As a conservative trader, I would only try to sell the pair if the price broke this trading range downwards. If the pair continues moving upwards, it most probably will test fibo-level of 50% (in the area of 1.3490).
RoboForex Analytical Department
Let’s take a look at the weekly chart (Fig. 1).
Fig. 1 EUR/USD, weekly time frame
So, in September and October the pair is being stuck between 1.2850 – 1.3150. As a matter of fact, it’s quite common when a correction is taking place and the price is moving between fibo-levels of 23.6% and 38.2%. Is an ascending correction going to continue? We’ll see. I think that while the pair is making a global descending movement, it’s better to open short positions and look for a good point of entry. If the level of 1.3150 is not broken upwards in the future, then the current local maximum will be one more bearish signal, as the previous ones were higher. At the chart we can see a series of descending maximums.
Now let’s look at the daily chart (Fig. 2).
Fig. 2 EUR/USD, daily time frame
At the daily chart we can see a continuation pattern, something like pennant. Right now it’s difficult to say whether it will be completed or not. As a conservative trader, I would only try to sell the pair if the price broke this trading range downwards. If the pair continues moving upwards, it most probably will test fibo-level of 50% (in the area of 1.3490).
RoboForex Analytical Department
Attention!
Forecasts presented in this section only reflect the author’s private opinion and should not be considered as guidance for trading. RoboForex bears no responsibility for trading results based on trading recommendations described in these analytical reviews.