Wave Analysis 12.02.2014 (DJIA Index, Crude Oil)
12.02.2014
Analysis for February 12th, 2014
DJIA Index
Index continues moving upwards. After completing short wave (2), price started growing up inside the third one and may continue moving upwards. Stop on my orders is already in the black.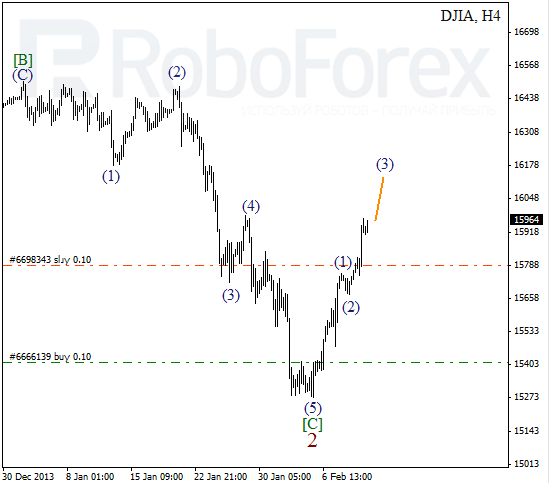
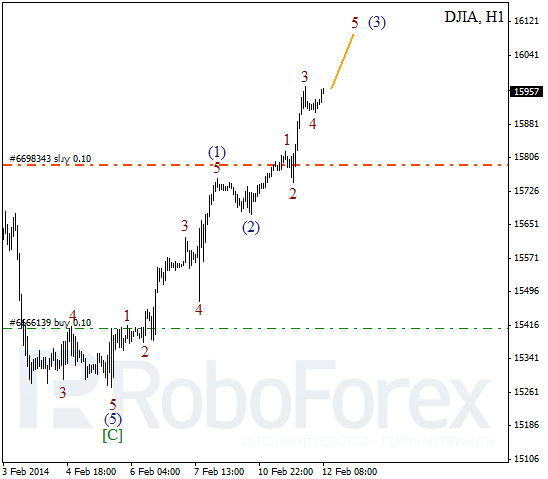
More detailed wave structure is shown on H1 chart. Index completed the fourth wave inside wave (3) and is about to start growing up inside the fifth one. Bulls may reach level of 16050 during the day.
Crude Oil
Oil moved very close to maximum of wave [B]. If price breaks this level, it may ruin bearish forecast, but until then, instrument may still complete wave (2). Probably, price may start falling down inside wave 1 during the day.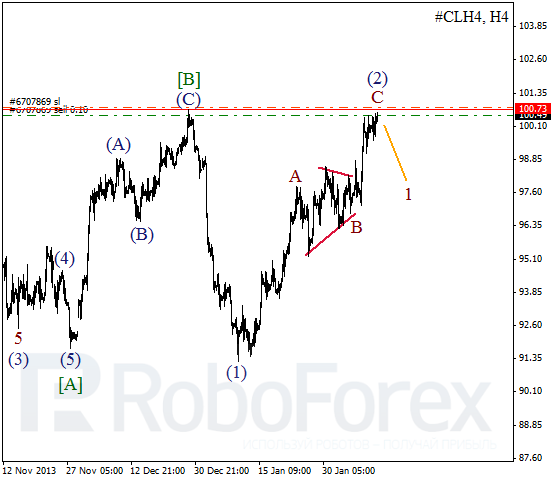
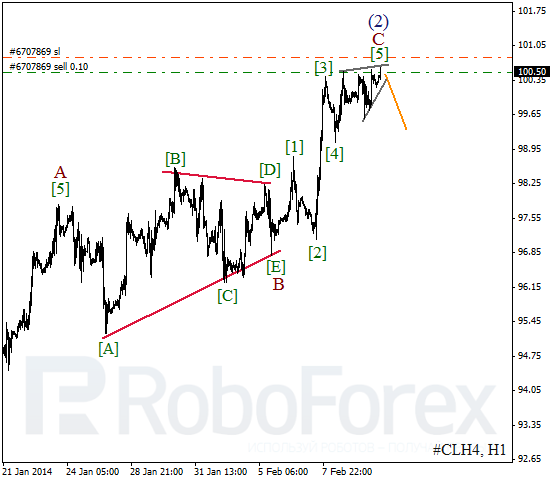
As we can see at the H1 chart, price formed diagonal triangle pattern inside wave [5] and I decided to open sell order with tight stop. I’ll move stop into the black as soon as instrument starts moving downwards.
RoboForex Analytical Department
Attention!
Forecasts presented in this section only reflect the author’s private opinion and should not be considered as guidance for trading. RoboForex bears no responsibility for trading results based on trading recommendations described in these analytical reviews.