Wave Analysis 21.03.2014 (DJIA Index, Crude Oil)
21.03.2014
Analysis for March 21st, 2014
DJIA Index
Index is still being corrected. Probably, wave [2] is taking the form of zigzag pattern with wave (B) being completed inside it. In the future, price is expected to start falling down inside wave (C) of [2].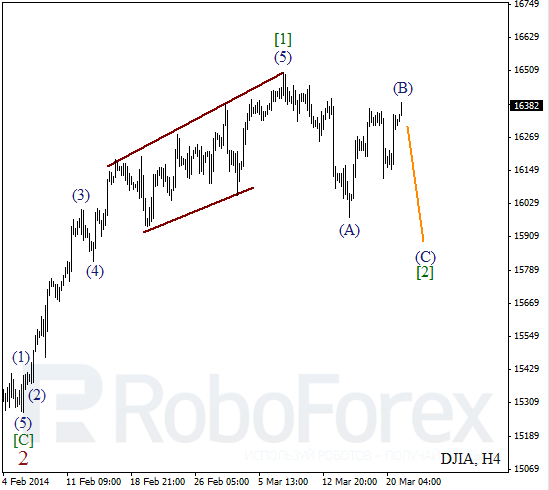
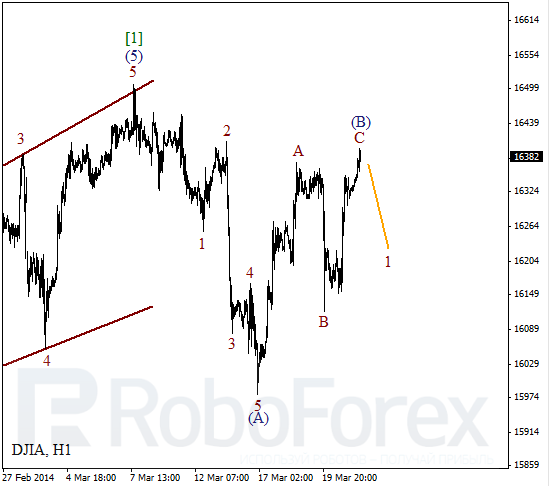
More detailed wave structure is shown on H1 chart. Probably, right now Index is finishing bullish impulse inside wave C. Most likely, in the nearest future market may start new descending movement inside the first wave.
Crude Oil
After forming bearish impulse inside wave 1, Oil started correction. Current chart structure implies that price may yet continue forming the second wave, but in the beginning of the next week instrument is expected to reverse and start forming the third one.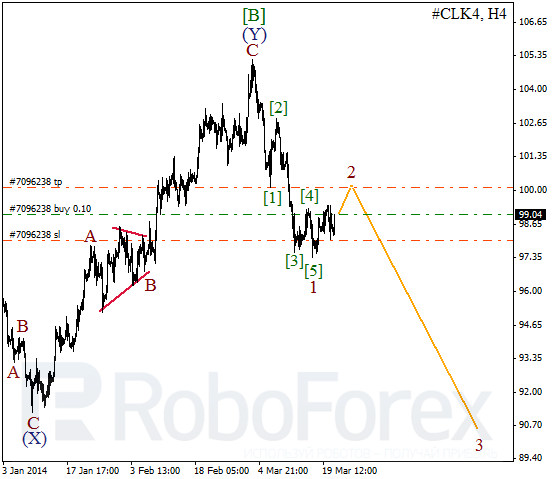
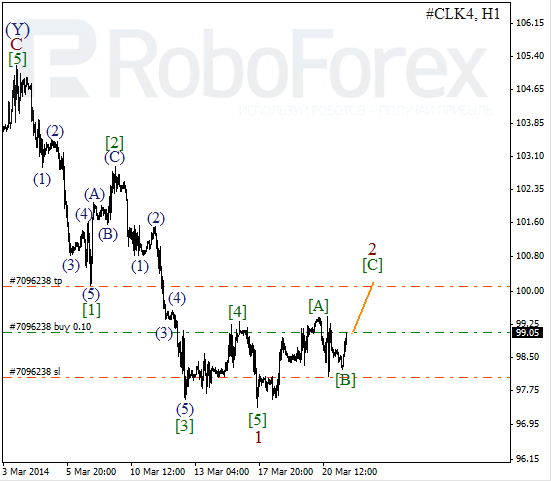
As we can see at the H1 chart, wave 2 is taking the form of zigzag pattern. I’ve got short-term buy order with close target. Later, after price finishes impulse inside wave [C] and forms initial descending wave, I’m planning to start opening sell orders.
RoboForex Analytical Department
Attention!
Forecasts presented in this section only reflect the author’s private opinion and should not be considered as guidance for trading. RoboForex bears no responsibility for trading results based on trading recommendations described in these analytical reviews.