Wave Analysis 25.03.2013 (DJIA Index, Crude Oil)
25.03.2013
Analysis for March 25th, 2013
DJIA Index
The Index continues moving upwards. After the market opening the bulls reached a new historic maximum. During the week the price is expected to continue growing up inside wave [5] of 5.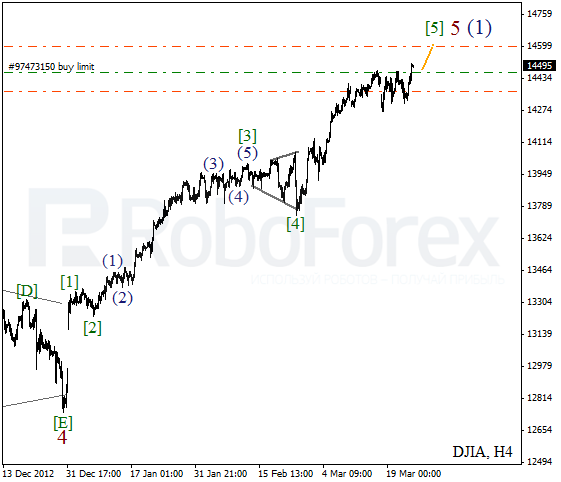
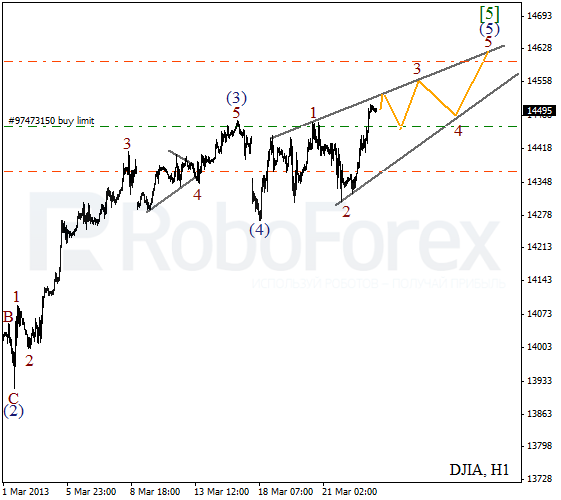
More detailed wave structure is shown on the H1 chart. It looks like the Index is forming diagonal triangle pattern inside the fifth wave (5). During the day the instrument is expected to continue forming zigzag pattern inside wave 3.
Crude Oil
We may assume that Oil started a new correction. We can’t exclude a possibility that wave [2] is taking the form of zigzag pattern. During the next several days the bulls are expected to continue pushing the price upwards. During the correction I’m planning to open a limit buy order.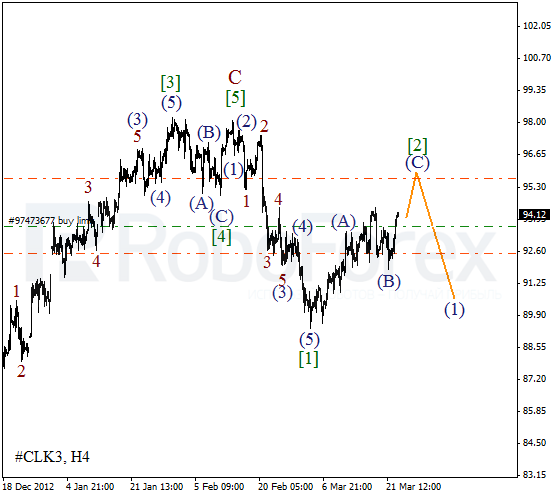
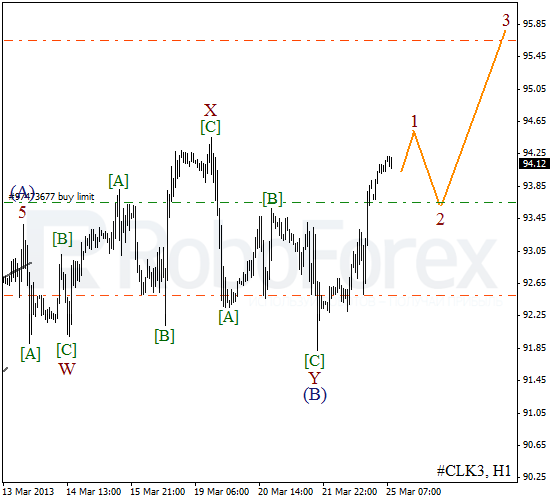
As we can see at the H1 chart, wave (B) was finished in the form of double three pattern. On the minor wave level the price is forming a bullish impulse inside wave 1. After a local correction Oil is expected to continue growing up and forming the third wave.
RoboForex Analytical Department
Attention!
Forecasts presented in this section only reflect the author’s private opinion and should not be considered as guidance for trading. RoboForex bears no responsibility for trading results based on trading recommendations described in these analytical reviews.