Wave Analysis 03.05.2013 (DJIA Index, Crude Oil)
03.05.2013
Analysis for May 3rd, 2013
DJIA Index
The Index continues forming diagonal triangle pattern inside the fifth wave. On the minor wave level, the price is forming wave (3). Most likely, the instrument will reach a new historic maximum during the day.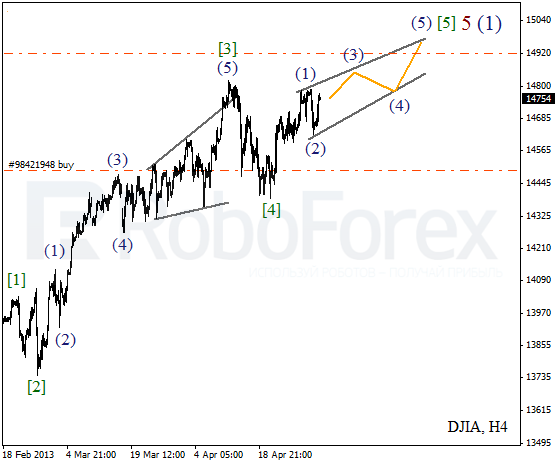
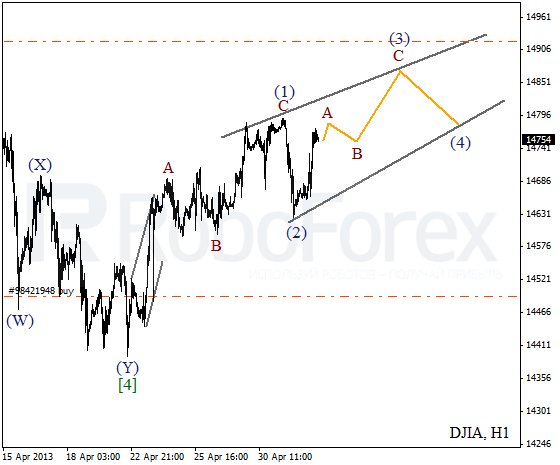
As we can see at the H1 chart, wave 2 turned out to be quite short. It looks like the third wave is going to take the form of zigzag pattern with wave A inside it. Later the instrument is expected to complete wave B and start moving upwards.
Crude Oil
Well, after all Oil continued forming wave [B]. We may assume that the current correction is taking the form of zigzag pattern. During the next several days the instrument is expected to break a local maximum and reach the upper border of triangle pattern.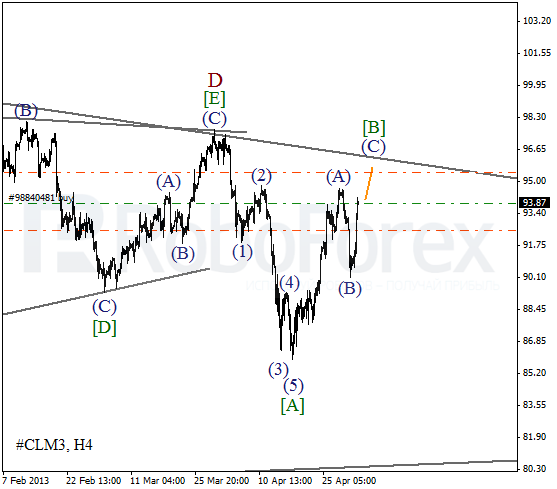
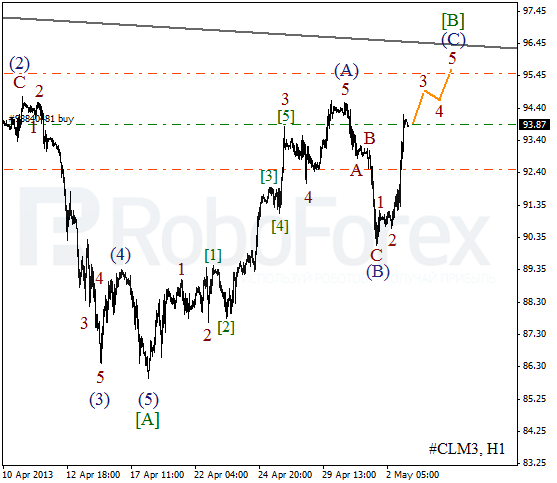
More detailed wave structure is shown on the H1 chart. After completing zigzag pattern inside wave [B], the price made a reverse upwards. During a correction I opened a buy order with the target at the level of $95.50 per barrel of Light Sweet.
RoboForex Analytical Department
Attention!
Forecasts presented in this section only reflect the author’s private opinion and should not be considered as guidance for trading. RoboForex bears no responsibility for trading results based on trading recommendations described in these analytical reviews.