Wave Analysis 12.05.2014 (DJIA Index, Crude Oil)
12.05.2014
Analysis for May 12th, 2014
DJIA Index
Chart structure is still bullish. Probably, after completing double three pattern inside wave [2], Index formed initial ascending wedge pattern inside wave (1). In the near term, correction inside wave (2) may continue.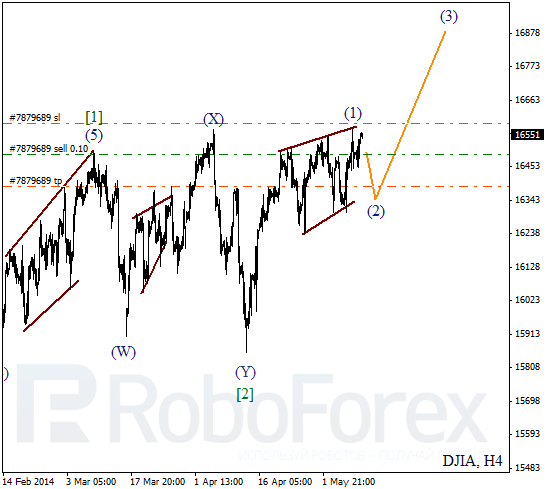
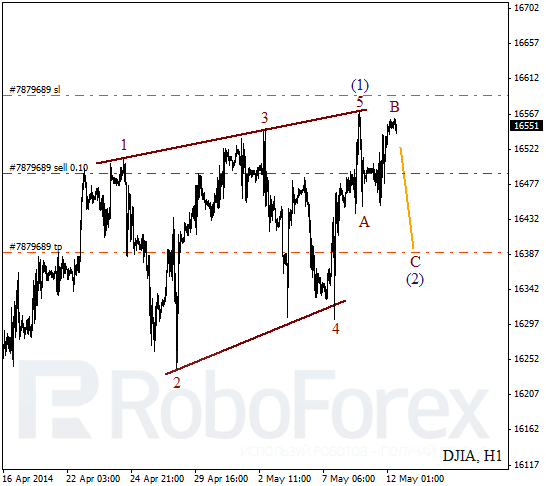
As we can see at the H1 chart, After rebounding from upper border of wedge pattern, market formed bearish impulse inside wave A. It looks like right now Index is finishing zigzag pattern inside wave B. In the near term, instrument is expected to move downwards inside wave C of (2).
Crude Oil
Probably, Oil continues forming the third wave. On minor wave level, price is being corrected. I’m planning to open sell order right after instrument starts falling down inside wave [3].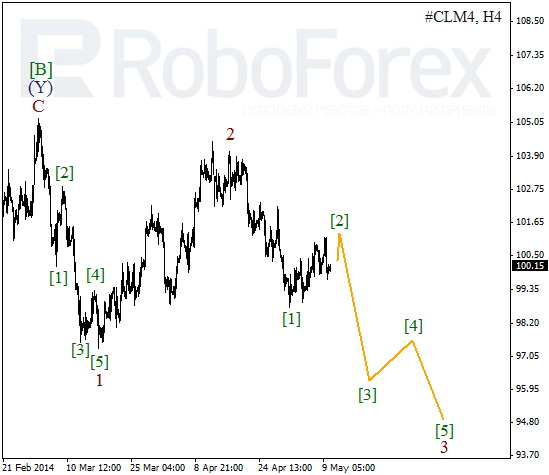
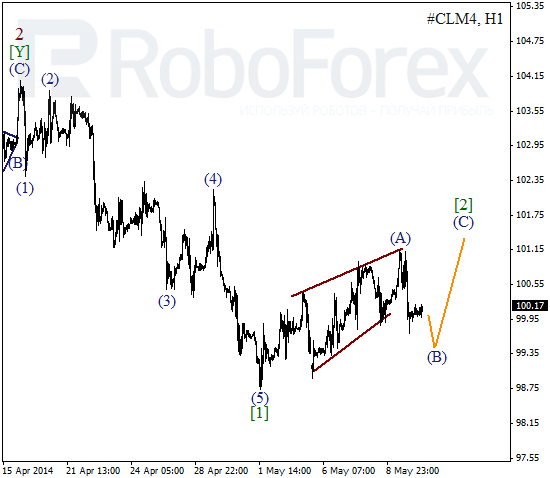
More detailed wave structure is shown on H1 chart. Probably, price formed wedge pattern inside wave (A). In the near term, Oil is expected to complete local correction and start moving upwards inside wave (C) of [2].
RoboForex Analytical Department
Attention!
Forecasts presented in this section only reflect the author’s private opinion and should not be considered as guidance for trading. RoboForex bears no responsibility for trading results based on trading recommendations described in these analytical reviews.