Wave Analysis 30.05.2013 (DJIA Index, Crude Oil)
30.05.2013
Analysis for May 30th, 2013
DJIA Index
At the H4 chart we can see, that the Index is making a reverse. We may assume that the price is forming an initial descending impulse inside wave (1). The current chart structure implies that the instrument completed wave [5] of 5.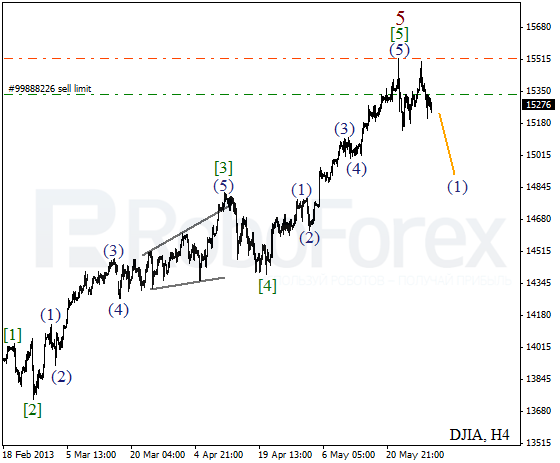
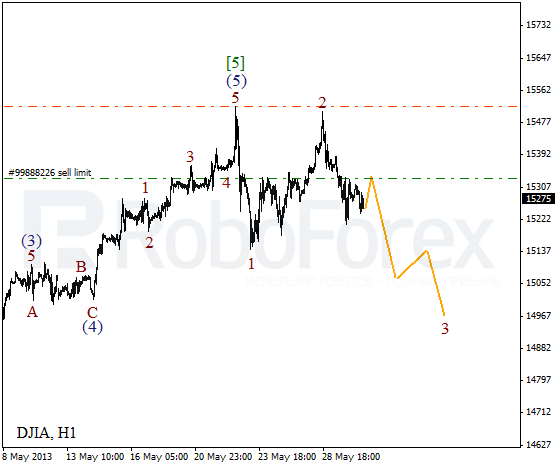
At the H1 chart, the second wave was completed near the maximum of the first one. Most likely, after finishing a local correction, the Index will start a new descending movement towards the level of 14900.
Crude Oil
Oil continues forming zigzag pattern inside wave 2. Earlier the price finished an ascending wedge pattern inside the first wave. I’m staying out of the market, but planning to open new buy orders as soon as the first bullish signals appear.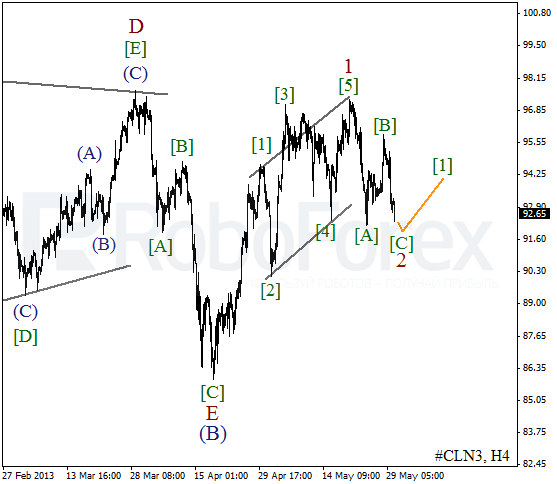
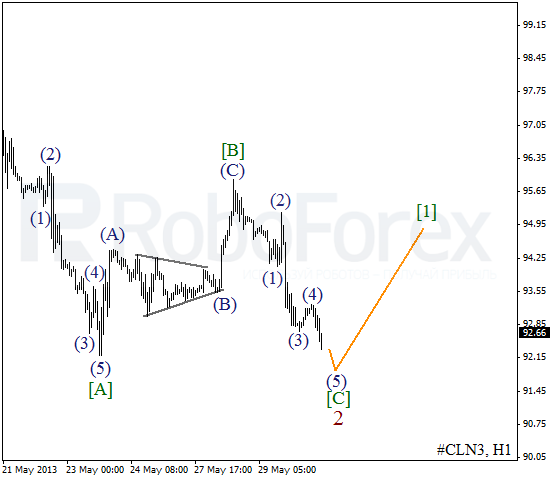
We can’t exclude a possibility that wave 2 may take the form of zigzag pattern. The bears are quite unlikely to keep the price below the minimum of wave [A] for a long time. Right now, the price needs several more bearish waves to complete wave (5) of [C]. If the instrument rebounds from the current levels, Oil will continue moving downwards.
RoboForex Analytical Department
Attention!
Forecasts presented in this section only reflect the author’s private opinion and should not be considered as guidance for trading. RoboForex bears no responsibility for trading results based on trading recommendations described in these analytical reviews.