Wave Analysis 03.06.2013 (DJIA Index, Crude Oil)
03.06.2013
Analysis for June 3rd, 2013
DJIA Index
It looks like the Index completely formed an impulse inside wave 5. On the minor wave level, the price is forming an initial wave (1). In order to start selling, we should wait until the price forms a descending impulse.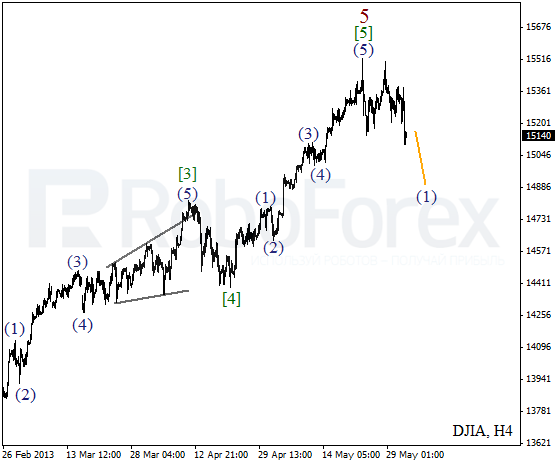
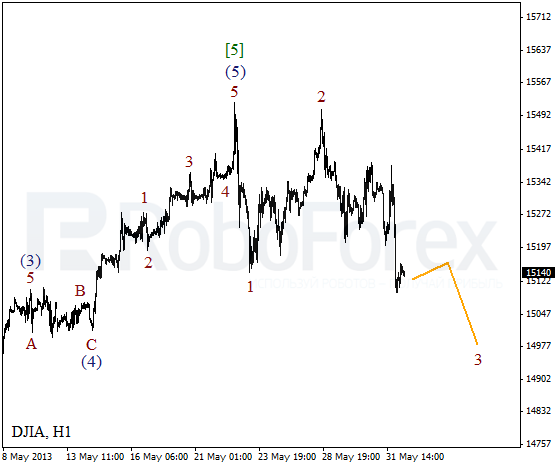
More detailed wave structure is shown on the H1 chart. It looks like the price is forming an extension inside wave 3. During Monday, a local correction may take place, but later the instrument is expected to continue falling down.
Crude Oil
Oil is still forming zigzag pattern inside wave 2. On the minor wave level, the price is forming an impulse inside wave [C]. Most likely, the instrument will continue moving downwards during the next several days, but later it may start forming an initial wave [1].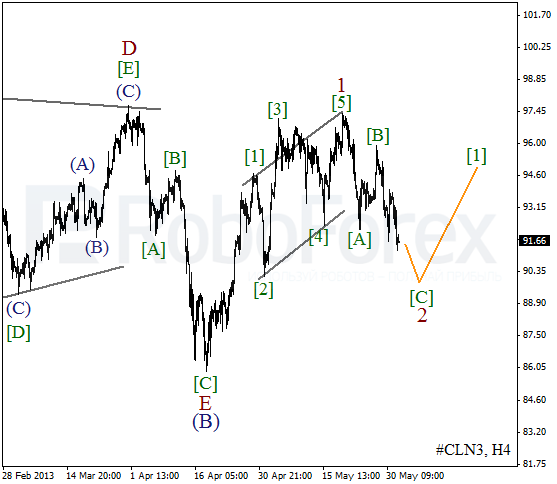
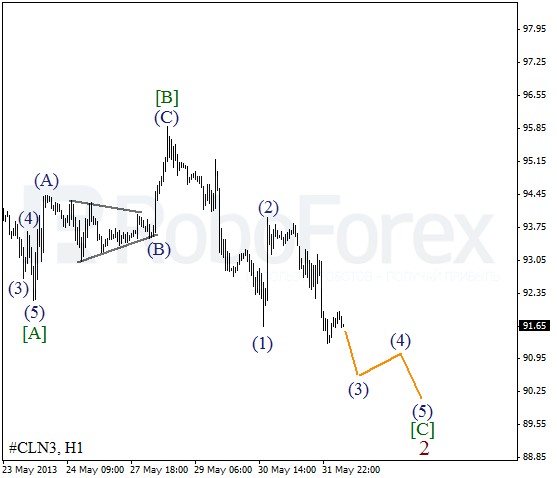
As we can see at the H1 chart, Oil is falling down inside the third wave. This wave is far from completion, that’s why the price may reach a new minimum during the next several hours. There is a possibility that the instrument may reach the level of $90 per barrel of Light Sweet during the week.
RoboForex Analytical Department
Attention!
Forecasts presented in this section only reflect the author’s private opinion and should not be considered as guidance for trading. RoboForex bears no responsibility for trading results based on trading recommendations described in these analytical reviews.