Wave Analysis 19.07.2013 (DJIA Index, Crude Oil)
19.07.2013
Analysis for July 19th, 2013
DJIA Index
Yesterday the Index reached a new historic maximum. However, the current structure of wave (3) implies that the price may continue moving upwards. This is why I’m keeping my buy order and expecting the instrument to reach new maximums again.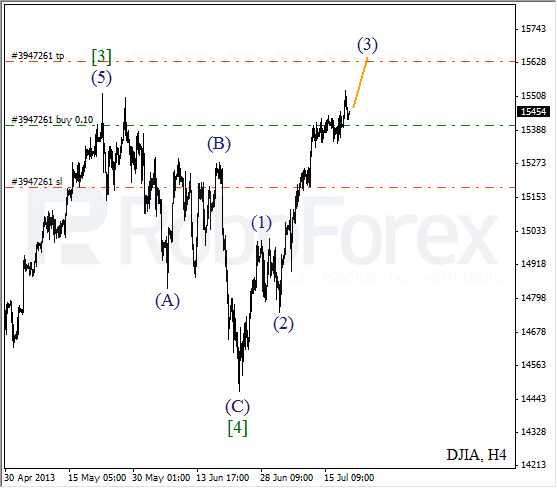
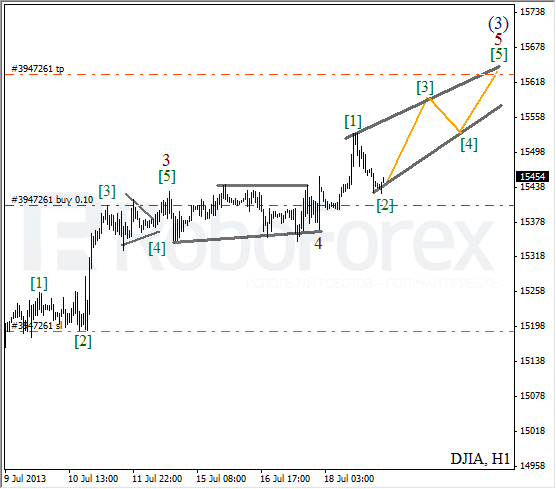
More detailed wave structure is shown on the H1 chart. After completing horizontal triangle pattern inside wave 4, the price started diagonal triangle pattern inside the fifth one. On the minor wave level, the instrument is expected to start wave (3) of 5.
Crude Oil
Oil also reached a new maximum yesterday. Before that, the price had completed triangle pattern inside wave (4). There is a possibility that the instrument may start a new ascending movement quite soon, that’s why I opened a short-term buy order during a local correction.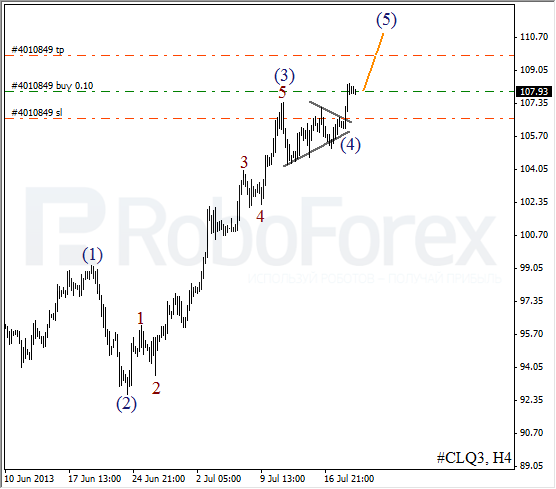
As we can see at the H1 chart, after completing triangle pattern inside wave (4), the price formed an initial bullish impulse. After a local correction, the price is expected to continue moving upwards inside wave 3.

RoboForex Analytical Department
Attention!
Forecasts presented in this section only reflect the author’s private opinion and should not be considered as guidance for trading. RoboForex bears no responsibility for trading results based on trading recommendations described in these analytical reviews.